

National NAPLAN results for 2026 are released today. This is the test of Australian students’ literacy and numeracy skills in years 3, 5, 7 and 9.
The Australian Curriculum, Assessment and Reporting Authority (which runs the test) has pointed to a “concerning” drop in Year 3 numeracy. It has hailed “signs of improvement” for other year levels in maths. It also reports that average reading scores in Years 5, 7 and 9 are lower than in 2025.
But the most remarkable takeaway from this year’s NAPLAN? None of the results are really any better or worse than those recorded since the NAPLAN scale was reset in 2023. What is going on?
Read more:
NAPLAN results are coming home. Here’s what parents should keep in mind
Tricky statistics
Each result in 2026 is close to all other results in recent years.
When we track groups of students going through school, all the small differences in averages between 2023, 2024, 2025 or 2026 are (according to the definition provided by the testing authority) “negligible in size”.
Given it is easier to find statistically significant group differences in large samples, no significant differences between any cohorts since 2023 is really remarkable.
What are the trends?
Graphs presenting NAPLAN results inevitably show trends that are likely to be misinterpreted in public analysis of the tests.
For example, numeracy scores for Years 5 and 7 have trended upwards since 2023. But the improvements of 6.1 and 9.5 scale scores (respectively) are small, given the scale spans from 1 to 1,000.
Year 3 numeracy scores have trended downwards, but this difference is even smaller, at 4.7 scale scores.
Reading outcomes in Year 3 have remained very stable, with those for Year 5 trending downwards – a reduction of 8.4 scale scores. Again, this is negligible in size. Reading scores for Years 7 and 9 have barely shifted, with 2026 results within 5 scale scores of those between 2023 and 2025.
These results for reading may appear surprising considering changes in the way early reading is taught, currently being rolled out around the country.
It is possible a test like NAPLAN is not precise enough to pick up the changes in students’ progress that may come as a result of teaching changes. On top of this, NAPLAN only assesses a narrow range of academic skills. NAPLAN may not be testing the relevant skills or abilities that show other improvements.
Tracking progress
One of the key goals of NAPLAN is to better monitor and track student progress. This is often overlooked in public reporting which tends to focus on average scores or proportions of students falling into proficiency bands.
Unlike school-based assessments, which typically focus on students’ attainment within a year level or curriculum stage, NAPLAN tests were specially designed to measure progress over several years – for example, to look at how much Year 5 students progressed from Year 3 in writing skills.
NAPLAN data therefore allows a good picture of typical developmental patterns. Rather than interpreting each year’s results in isolation, schools can use longitudinal data to identify where students are not making expected gains.
Progress and proficiency bands
Another way to think about progress is to look at proportions of students in each of the four proficiency bands.
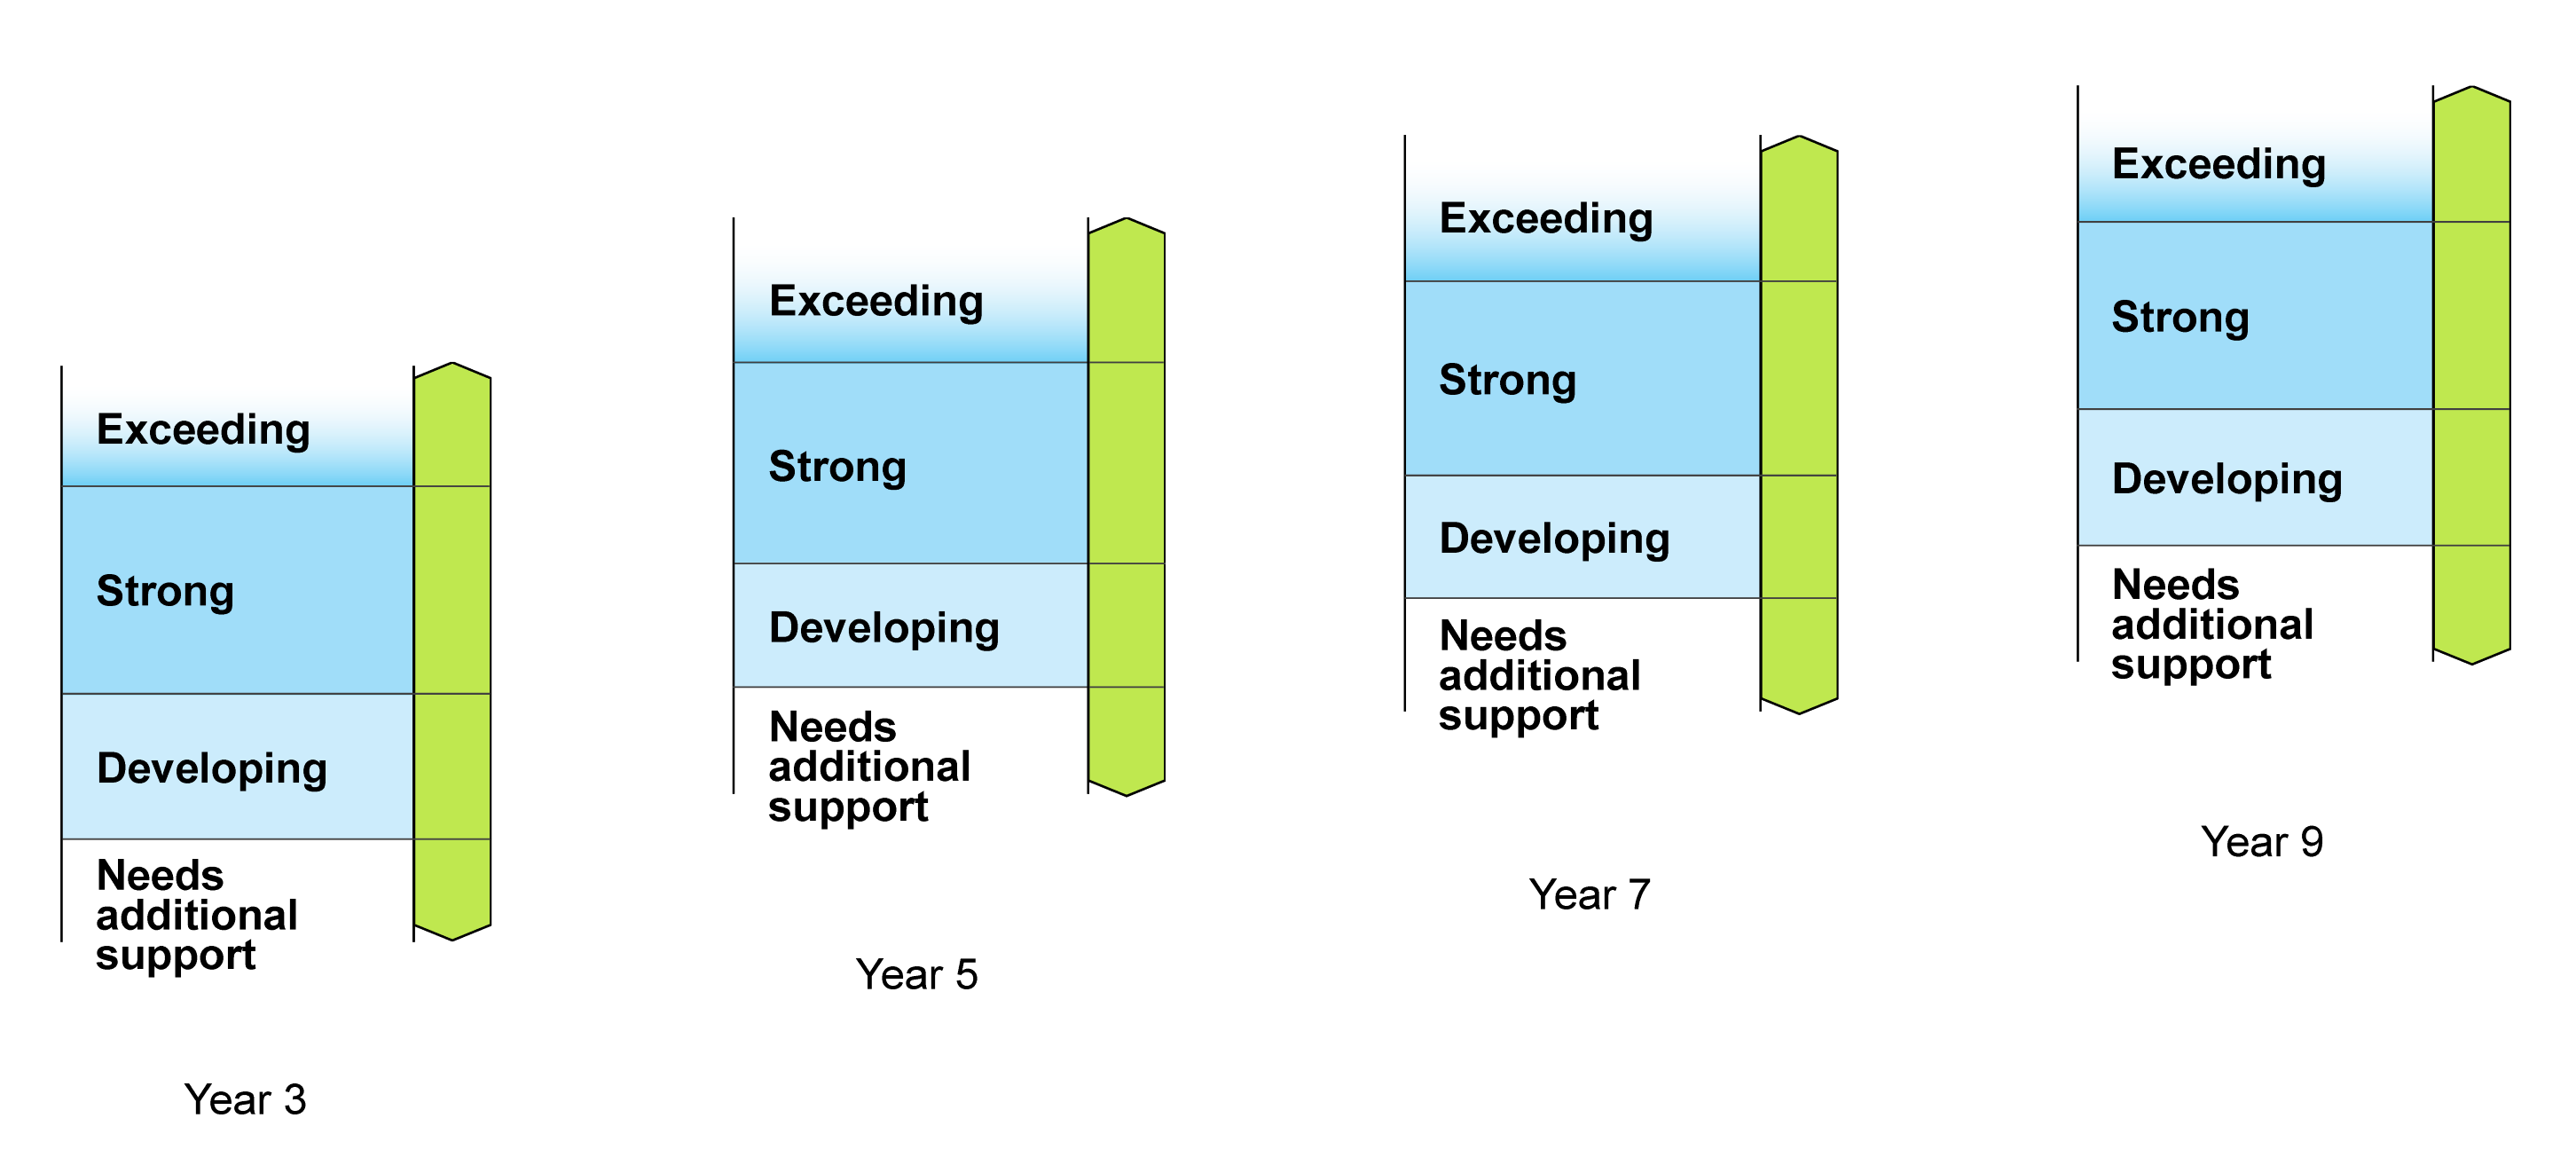
When the NAPLAN tests were revised in 2023, the reporting scale was reset. Now parents and schools receive information about students’ achievement in one of four bands: “needs additional support”, “developing”, “strong” and “exceeding”.
A great deal of attention is focused on the proportions of students in the bottom two bands. About 30% of students are in these two bands each year, with some variability between states and territories.
This year’s data shows the same pattern across the four tested grades at the national level, with some small differences depending on different demographic groups. But this does not mean 30% of students are “failing”, as is often reported.
Less attention is paid to whether and how students in each proficiency band make progress from one test to the next.
If students fall into the “developing” proficiency band, this means “the student’s result indicates that they are working towards expectations at the time of testing”. Since the tests take place at the beginning of the school year, students will continue to work towards expectations as they progress through the year. With the right support, these students will continue to improve.
The reality is most students make progress on NAPLAN tests over time. My own research has shown students with the poorest performance in Year 3 make the largest gains in both reading and numeracy by the time they reach Year 9. It is worth noting the cut-off scores used to create the bands increase from one year level to the next, representing the increased expectations as children move through school.
A student in the “needs additional support” band in Year 3, and again in Year 5 will usually have made progress across the two years.
No surprises, but still useful
It is likely teachers and principals will already be aware of which students need additional support. A key part of teachers’ everyday work is to monitor students’ progress. So NAPLAN results may provide confirmation for schools about students’ achievement rather than surprises.
That said, tracking all students’ progress is important for ensuring they are continually supported and don’t get “lost” in the system.
This may happen especially as students move from from primary to high school. Better use of longitudinal NAPLAN data could help schools identify students who will likely need extra help as they start high school. For example, better monitoring of kids struggling in Year 5 could help secondary school teachers design and implement more targeted supports when students arrive in Year 7.
NAPLAN going forward
There will likely be media reports about the new results claiming students’ literacy and numeracy skills are not “meeting expectations”.
But careful examination of the 2026 data does not support this interpretation. It also detracts from the useful information we can learn about where students are up to with literacy and numeracy.

Sally Larsen does not work for, consult, own shares in or receive funding from any company or organisation that would benefit from this article, and has disclosed no relevant affiliations beyond their academic appointment.
Read More: Read More